Monitoring ClickHouse Performance and Errors with Tracing
What is tracing?
Distributed tracing allows to precisely pinpoint the problem in complex systems, especially those built using a microservices architecture.
Tracing allows to follow requests as they travel through distributed systems. You get a full context of what is different, what is broken, and which logs & errors are relevant.
What is OpenTelemetry?
OpenTelemetry is an open source and vendor-neutral API for distributed tracing (including logs and errors) and metrics.
Otel specifies how to collect and export telemetry data in a vendor agnostic way. With OpenTelemetry, you can instrument your application once and then add or change vendors without changing the instrumentation, for example, many open source tracing tools already support OpenTelemetry.
chotel instrumentation
go-clickhouse supports tracing and metrics using OpenTelemetry API. OpenTelemetry is a vendor-neutral API for distributed traces and metrics. It specifies how to collect and send telemetry data to backend platforms. It means that you can instrument your application once and then add or change vendors (backends) as required.
go-clickhouse comes with an OpenTelemetry instrumentation called chotel that is distributed as a separate module:
go get github.com/uptrace/go-clickhouse/chotel
To instrument go-clickhouse database, you need to add the hook provided by chotel:
import (
    "github.com/uptrace/go-clickhouse/ch"
    "github.com/uptrace/go-clickhouse/chotel"
)

db := ch.Connect(ch.WithDatabase("test"))
db.AddQueryHook(chotel.NewQueryHook())
Uptrace
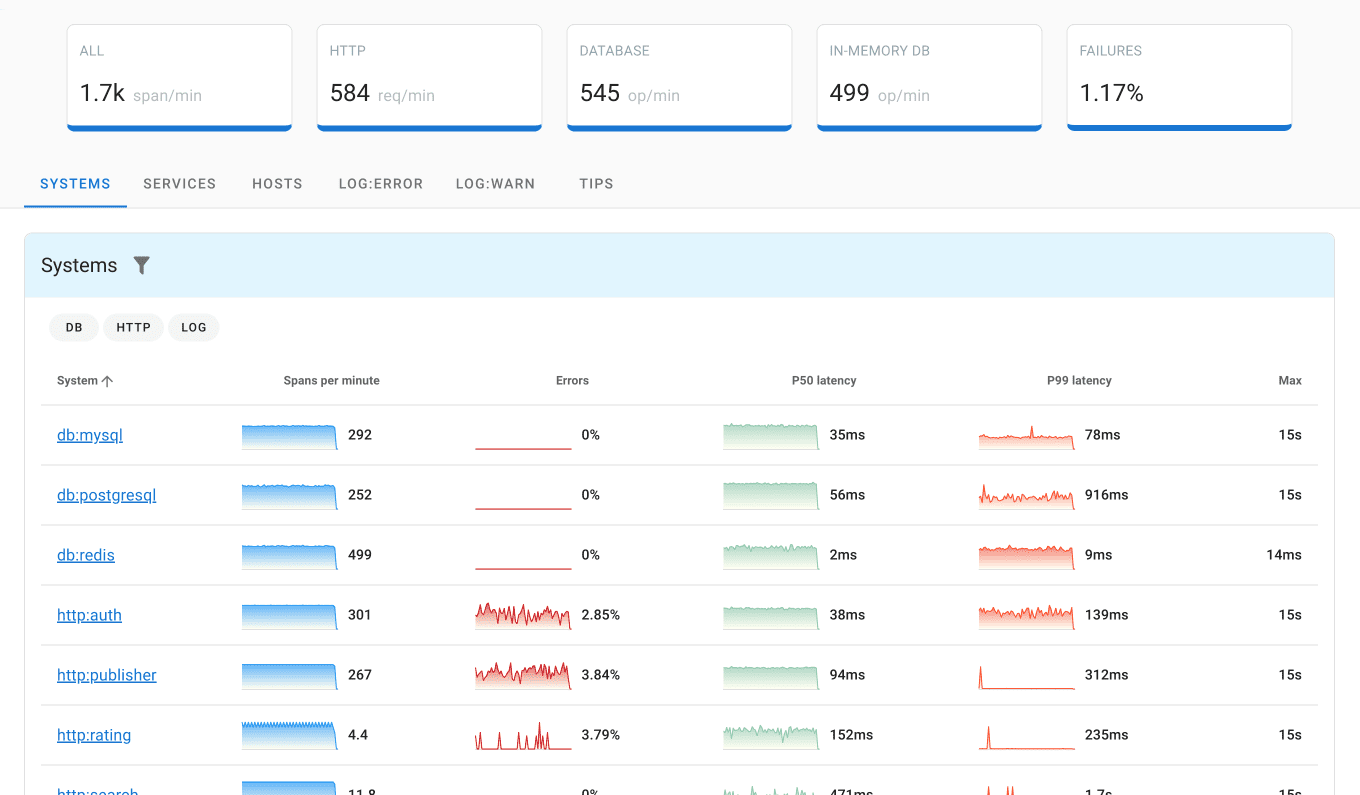
Uptrace is an open-source APM and a popular DataDog competitor that supports distributed tracing, metrics, and logs. You can use it to monitor applications and set up automatic alerts to receive notifications via email, Slack, Telegram, and more.
You can install Uptrace by downloading a DEB/RPM package or a pre-compiled binary.
Trace example
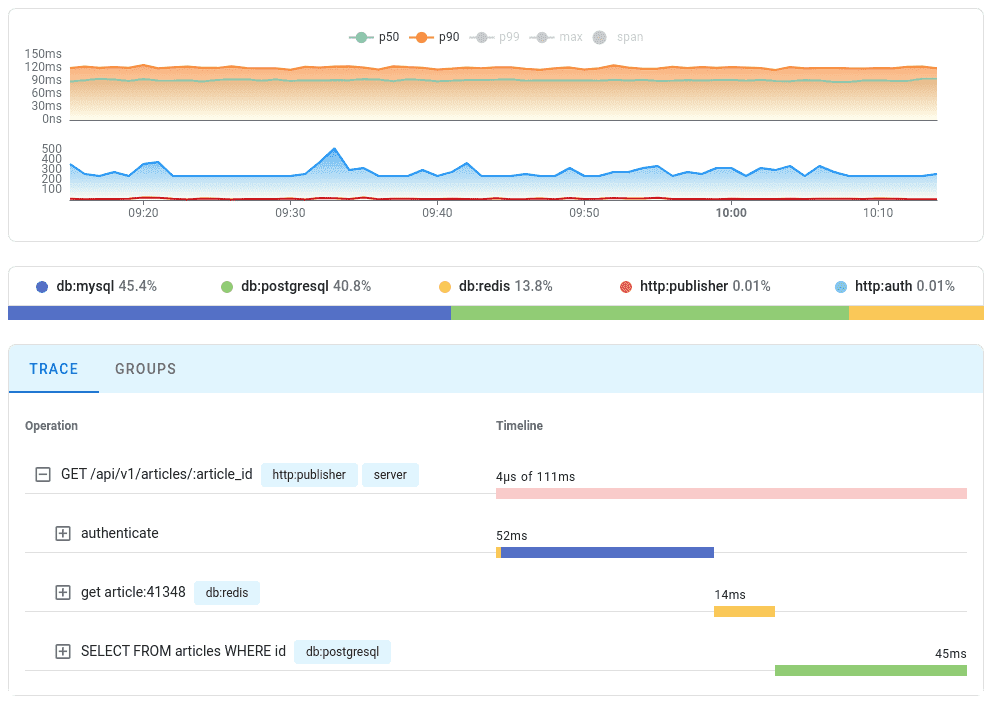
As expected, go-clickhouse creates spans for processed queries and records any errors as they occur. Here is how the collected information is displayed at Uptrace UI:
You can find a runnable example at GitHub.
ClickHouse spans
To trace the ClickHouse database, you can setup a materialized view to export spans from the system.opentelemetry_span_log table:
CREATE MATERIALIZED VIEW default.zipkin_spans
ENGINE = URL('https://api.uptrace.dev/api/v2/spans?dsn=https://<key>@uptrace.dev/<project_id>', 'JSONEachRow')
SETTINGS output_format_json_named_tuples_as_objects = 1,
    output_format_json_array_of_rows = 1 AS
SELECT
    lower(hex(trace_id)) AS traceId,
    case when parent_span_id = 0 then '' else lower(hex(parent_span_id)) end AS parentId,
    lower(hex(span_id)) AS id,
    operation_name AS name,
    start_time_us AS timestamp,
    finish_time_us - start_time_us AS duration,
    cast(tuple('clickhouse'), 'Tuple(serviceName text)') AS localEndpoint,
    attribute AS tags
FROM system.opentelemetry_span_log
See ClickHouse documentation for details.